Advanced RE Toolkit (2/5): emulation and instrumentation with Unicorn, Qiling, Speakeasy and DynamoRIO
TL;DR
Debuggers and DBI run the program on the real machine, while emulation replaces both CPU and OS. Unicorn runs a single function (for example a malware config decryptor), Qiling adds loaders and syscalls, Speakeasy models Windows for malware, and DynamoRIO collects coverage for Lighthouse or Cartographer.
On this page
You are analysing a malware sample in your lab. Ghidra shows the command-and-control (C2) address stored as a meaningless encrypted byte array, plus a decryption routine a few hundred instructions long. Reading it by hand takes an afternoon. Running the sample for real is risky. There is a third option: run just that function on a virtual CPU, read the result, and the sample never touches your real operating system.
That is the job of emulation and instrumentation tools. This post covers four key repos: Unicorn, Qiling, Speakeasy and DynamoRIO. A fun fact for Vietnamese readers: according to Unicorn's CREDITS file, the two key developers at the top of the list are Nguyen Anh Quynh and Dang Hoang Vu, and Quynh is also an advisor to Qiling.
Debugger, DBI or emulation: which one?
All three let you watch code run, but they differ in where the code actually runs:
| Approach | Where the code runs | Best for | Tools |
|---|---|---|---|
| Debugger | Real CPU and OS, stopping at breakpoints | Inspecting state at a specific point | GDB, x64dbg |
| DBI (dynamic binary instrumentation) | Real CPU and OS, but each code block is copied and instrumented | Coverage, tracing every instruction, fuzzing large apps | DynamoRIO, Frida |
| CPU emulation | Virtual CPU, no OS | Running a single function or shellcode, even for another architecture | Unicorn |
| Full OS emulation | Virtual CPU + modelled OS (loader, syscalls, APIs) | Running whole executables, firmware or Windows samples without the target machine | Qiling, Speakeasy |
Unicorn: a virtual CPU in a few lines of Python
Unicorn is a QEMU-based CPU emulator framework supporting x86 (16/32/64-bit), ARM, ARM64, MIPS, PowerPC, RISC-V, SPARC, S390X, M68K and TriCore. The core is written in C, with bindings for Python, Rust, Go, Java, .NET and many more. Unicorn only understands machine instructions: it knows nothing about ELF/PE files, shared libraries or syscalls. You allocate memory, load the code, set registers and tell it to run. That bare-bones design is exactly why it suits running one function in isolation.
The example below recreates the opening scenario: an XOR loop that decrypts a string, written as 11 bytes of x86-64 machine code. In practice you copy the encrypted bytes and the decryption routine out of Ghidra. Here we build the data ourselves so the example is self-contained.
# pip install unicorn
from unicorn import Uc, UC_ARCH_X86, UC_MODE_64, UC_HOOK_CODE
from unicorn.x86_const import UC_X86_REG_RSI, UC_X86_REG_RCX

# xor byte [rsi], 0x5A ; inc rsi ; dec rcx ; jnz (back to start)
CODE = bytes.fromhex("80365A" "48FFC6" "48FFC9" "75F5")
CODE_ADDR, DATA_ADDR = 0x1000000, 0x2000000
blob = bytes(b ^ 0x5A for b in b"http://c2.example/cfg")  # in practice: copied from the sample

mu = Uc(UC_ARCH_X86, UC_MODE_64)
mu.mem_map(CODE_ADDR, 0x1000)
mu.mem_map(DATA_ADDR, 0x1000)
mu.mem_write(CODE_ADDR, CODE)
mu.mem_write(DATA_ADDR, blob)
mu.reg_write(UC_X86_REG_RSI, DATA_ADDR)   # arg 1: data pointer
mu.reg_write(UC_X86_REG_RCX, len(blob))   # arg 2: length

steps = 0
def on_code(uc, address, size, user_data):   # called before every instruction
    global steps
    steps += 1
mu.hook_add(UC_HOOK_CODE, on_code)

mu.emu_start(CODE_ADDR, CODE_ADDR + len(CODE))
print(bytes(mu.mem_read(DATA_ADDR, len(blob))).decode(), "|", steps, "instructions")
The expected output is the string http://c2.example/cfg after 84 instructions (21 iterations × 4 instructions). Hooks do far more than count: you can hook per instruction, per basic block, per memory read/write, or catch accesses to unmapped memory to learn what data a function still needs.
- Common trap: as soon as the function calls
malloc,strlenor a syscall, Unicorn stops with an error because there is no OS. Write a stub with a hook, or move up to Qiling. - Map a stack region and set
RSPif the function usespush/call, as the project's official x86-64 test does. - The latest release is 2.1.4. It is licensed GPL-2.0, which matters if you plan to embed Unicorn in a product you ship.
Qiling: an operating system on top of Unicorn
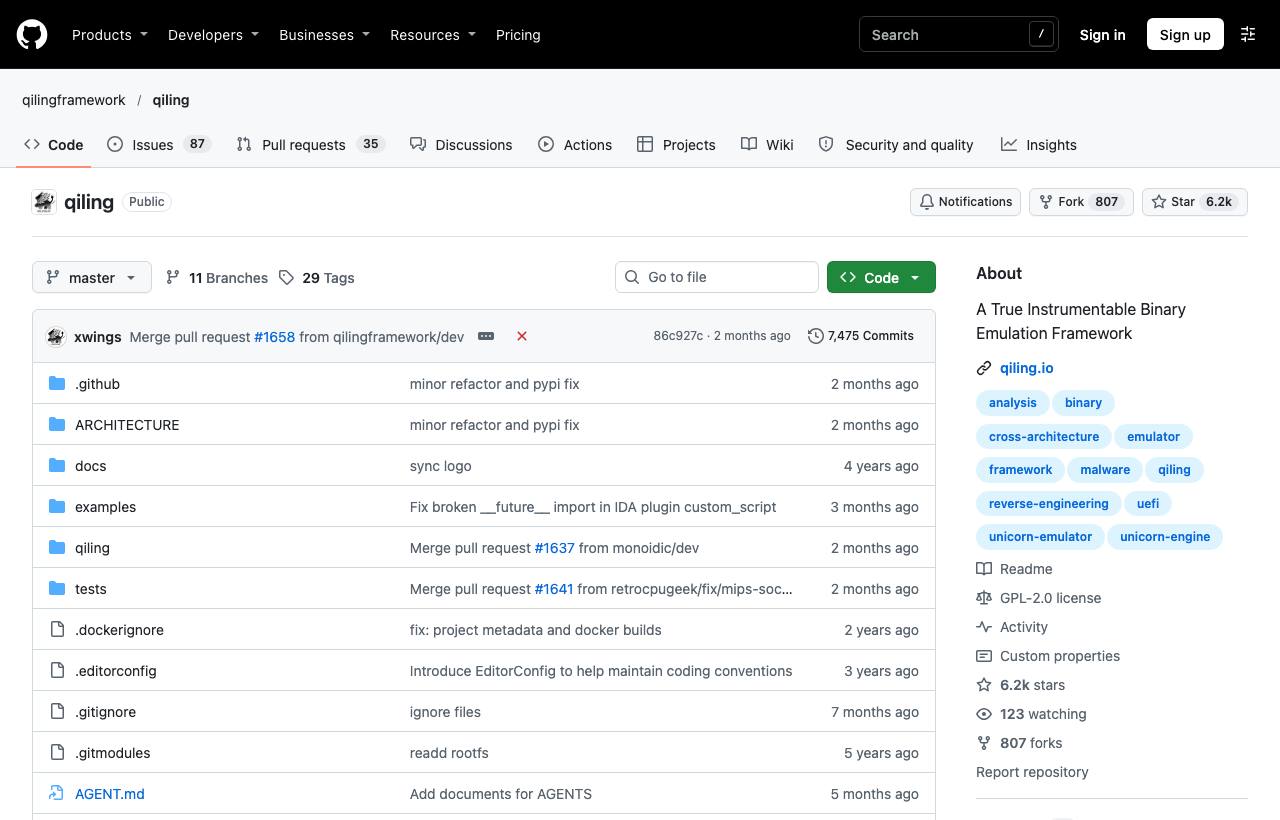
Qiling uses Unicorn to execute instructions and fills in everything Unicorn leaves out: loaders for PE, ELF and Mach-O, a dynamic linker, and syscall and I/O handling. It emulates Windows, macOS, Linux, Android, BSD, UEFI, DOS and MBR across many architectures (x86, x86-64, ARM, ARM64, MIPS, RISC-V, PowerPC). According to its README, what sets it apart from QEMU user mode is that Qiling is a Python framework: hooks at every level (instruction, basic block, memory, syscall), hot-patching of running code, saving and restoring state, and a built-in GDB server. It can even run a Linux ELF on top of Windows.
pip install qiling
qltool -h

# Run a binary with a rootfs (a folder with the target system's libraries)
qltool run -f examples/rootfs/x8664_linux/bin/x8664_hello --rootfs examples/rootfs/x8664_linux/

# Start a GDB server so you can attach IDA/GDB and step through
qltool run -f examples/rootfs/x8664_linux/bin/x8664_hello --gdb 127.0.0.1:9999 --rootfs examples/rootfs/x8664_linux
from qiling import Qiling
def on_check(ql):
print("Reached the license check function")
ql = Qiling([r"rootfs/x8664_linux/bin/app"], r"rootfs/x8664_linux")
ql.hook_address(on_check, 0x401136) # address from Ghidra (non-PIE binary)
ql.run()For IoT firmware, the rootfs is simply the folder you extracted with binwalk or unblob (see the firmware analysis post). The README shows an ARM router's httpd running and being fuzzed on an x86-64 Ubuntu host. Note that the example binaries and rootfs must be downloaded separately. An unsupported syscall will stop the program; in that case you write your own replacement.
Speakeasy: a “fake Windows” for malware
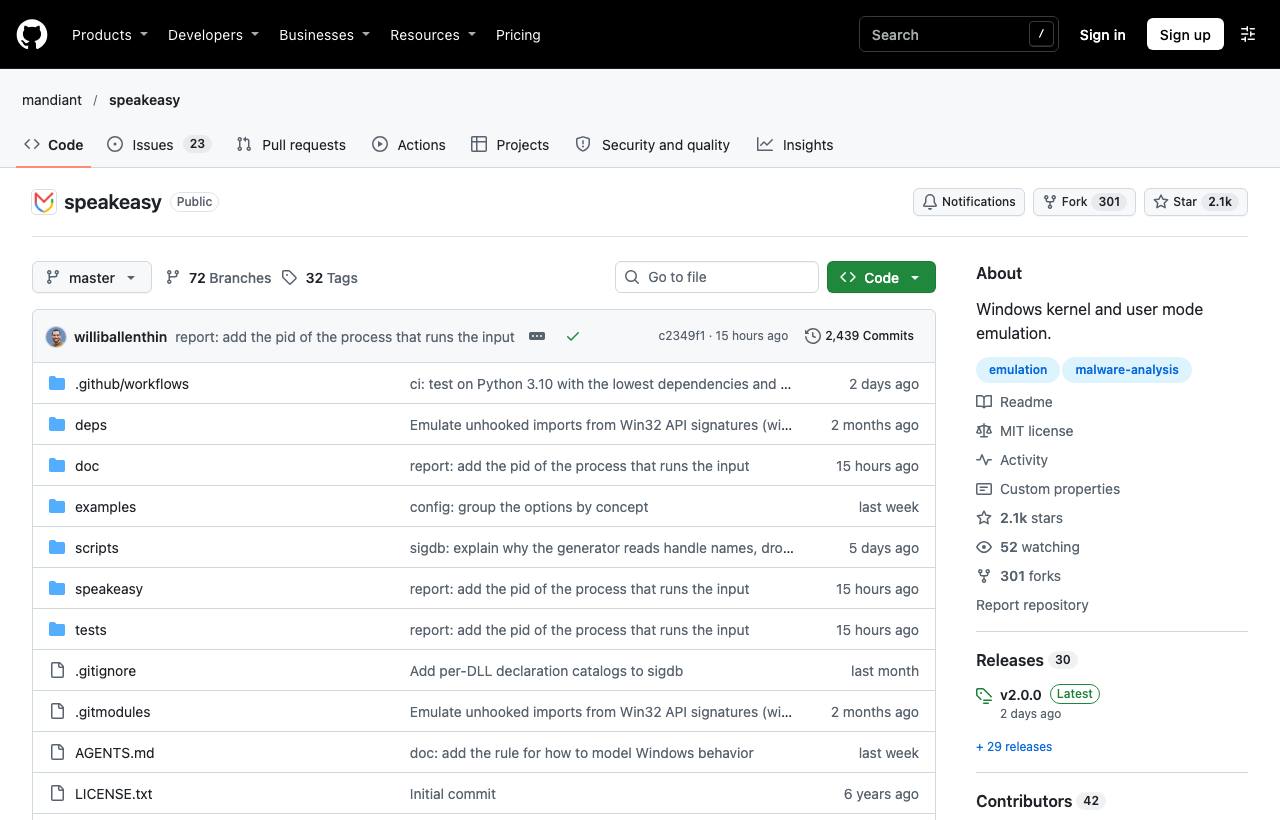
Mandiant's Speakeasy runs Windows EXEs, DLLs, kernel drivers and shellcode in a modelled Windows runtime instead of a full VM: APIs, processes, threads, file system, registry and network are all emulated. The sample therefore gets much further than on a bare virtual CPU, and every behaviour lands in a JSON report. Version 2.0.0 shipped on 17 November 2026 and requires Python 3.10 or later.
python3 -m pip install speakeasy-emulator

# Emulate a sample, write a JSON report, then peek at a few fields
speakeasy -t sample.dll --no-mp -o report.json 2>/dev/null
jq '{sha256, arch, file_type, runs: (.runs | length)}' report.json

# Raw shellcode: the architecture must be given
speakeasy --target shellcode.bin --raw --arch x86 --output report.json

# See which runs stopped early because of an error
speakeasy --target sample.exe | jq '.runs[].error'
By default every feature is on: it runs exports and child processes, and records code coverage and final memory contents. Each feature has a --no-… flag to switch it off for a faster run. As a Python library, you can hook a specific API, for example add_api_hook(cb, "user32", "MessageBox*"), and read the decoded arguments. A config file can also fake DNS and HTTP responses so the sample “believes” it reached its C2.
- Limits: behaviour after an unmodelled API may be wrong. Malware with anti-emulation tricks may detect the fake environment and change course. Treat the report as a starting point, not a verdict.
DynamoRIO: instrumenting programs that really run
DynamoRIO is a DBI platform. The program runs on real Windows, Linux or Android (x86, x86-64, ARM, AArch64; macOS support is in progress), but each piece of code is copied into a cache where it can be modified or instrumented before it executes. The release ships with ready-made tools: Dr. Memory (memory bug finder), drltrace (library call tracing), drstrace (“strace for Windows”) and drcov (code coverage). WinAFL, the Windows fuzzer from Google Project Zero, uses DynamoRIO as its coverage engine. The main license is BSD, with some extensions under LGPL 2.1.
# Collect coverage: writes drcov.<app>.<pid>....log per process
bin64/drrun -t drcov -- ./target input.bin

# Have the source? Convert to lcov format and render HTML
tools/bin64/drcov2lcov -input drcov.target.30239.0000.proc.log -src_filter mydir
perl tools/bin64/genhtml coverage.info
Without source, load the .log file into Lighthouse (a plugin for IDA Pro and Binary Ninja) or Cartographer (NCC Group's Ghidra plugin). They paint the executed basic blocks right inside your disassembler. Compare two runs (correct vs wrong login) and the deciding branch jumps out. If you need flexible JavaScript hooks, Frida is still handier; see the dynamic analysis post.
Sample workflow: decrypting a config without running the sample
- Triage with Speakeasy: run the sample in a lab VM without network access and read the report: which APIs it calls, which files it creates, whether any URLs leak out.
- Narrow it down in Ghidra: if the config is still encrypted, find the function called right before the data is used. Note the function address, the data region and the calling convention.
- Run it alone in Unicorn: load the function code and the byte array as in the example above, set the argument registers, read the result. Turn it into a script to decrypt a whole family of samples.
- OS-dependent functions: move up to Qiling (Linux, firmware) or use Speakeasy's API hooks (Windows).
- For your own software: use drcov to measure coverage while tests run, find untested code, and feed it to fuzzing.
Risks, legal and ethics
- Emulation is not a perfect sandbox. Unicorn and Qiling run inside your Python process, and parsers and emulators can have bugs. Always analyse unknown samples in a VM with no network and with snapshots.
- DBI and debuggers let the sample really run, with all the power of a normal program. Never do this on a personal or corporate machine.
- Licenses: Unicorn and Qiling are GPL-2.0, Speakeasy is MIT, DynamoRIO is mostly BSD. Check before putting them in a commercial product.
- Legal: only analyse your own software, legally obtained malware samples, or software you have written authorisation for. EULA clauses banning reverse engineering still apply in many jurisdictions.
What should you do?
- Dev: start with Unicorn and a small function you compiled yourself, and compare the emulated result with a real run. Use drcov to measure your own project's test coverage before touching unknown samples.
- Tech Lead / SOC: standardise an analysis VM with Speakeasy, Qiling, Unicorn and Ghidra preinstalled. Turn config-decryption scripts into a shared team library with test samples.
- PM: emulation cuts IOC extraction (C2 addresses, keys) from hours of manual reading to minutes of running a script. The trade-off is the up-front time to build the lab and write the first scripts.
Advanced RE Toolkit series
- Decompiling Java and Python: Recaf, Vineflower, pyinstxtractor
- Emulation and instrumentation: Unicorn, Qiling, Speakeasy, DynamoRIO (this post)
- Building a malware analysis lab: FLARE-VM, REMnux, CAPEv2, PE-sieve
- radare2, Rizin and automation with r2pipe
- AI-assisted decompilation: LLM4Decompile, Gepetto, ReVa, Decompiler Explorer
New to RE? Start the fundamentals series at Reverse Engineering (1/5): from source code to binary and assembly, and the basic toolkit at RE Toolkit (1/5): MCP servers for reverse engineering.
Sources & references
- Unicorn Engine (README, CREDITS, Python bindings) — unicorn-engine (GitHub)
- Tutorial for Unicorn — unicorn-engine.org
- Qiling Framework (README, CREDITS) — qilingframework (GitHub)
- Qiling Installation — Qiling wiki
- Speakeasy (README, CLI reference, library usage) — Mandiant (GitHub)
- DynamoRIO — DynamoRIO (GitHub)
- Code Coverage Tool (drcov) — dynamorio.org
- Lighthouse – Collecting Coverage — gaasedelen (GitHub)
- Cartographer — NCC Group (GitHub)